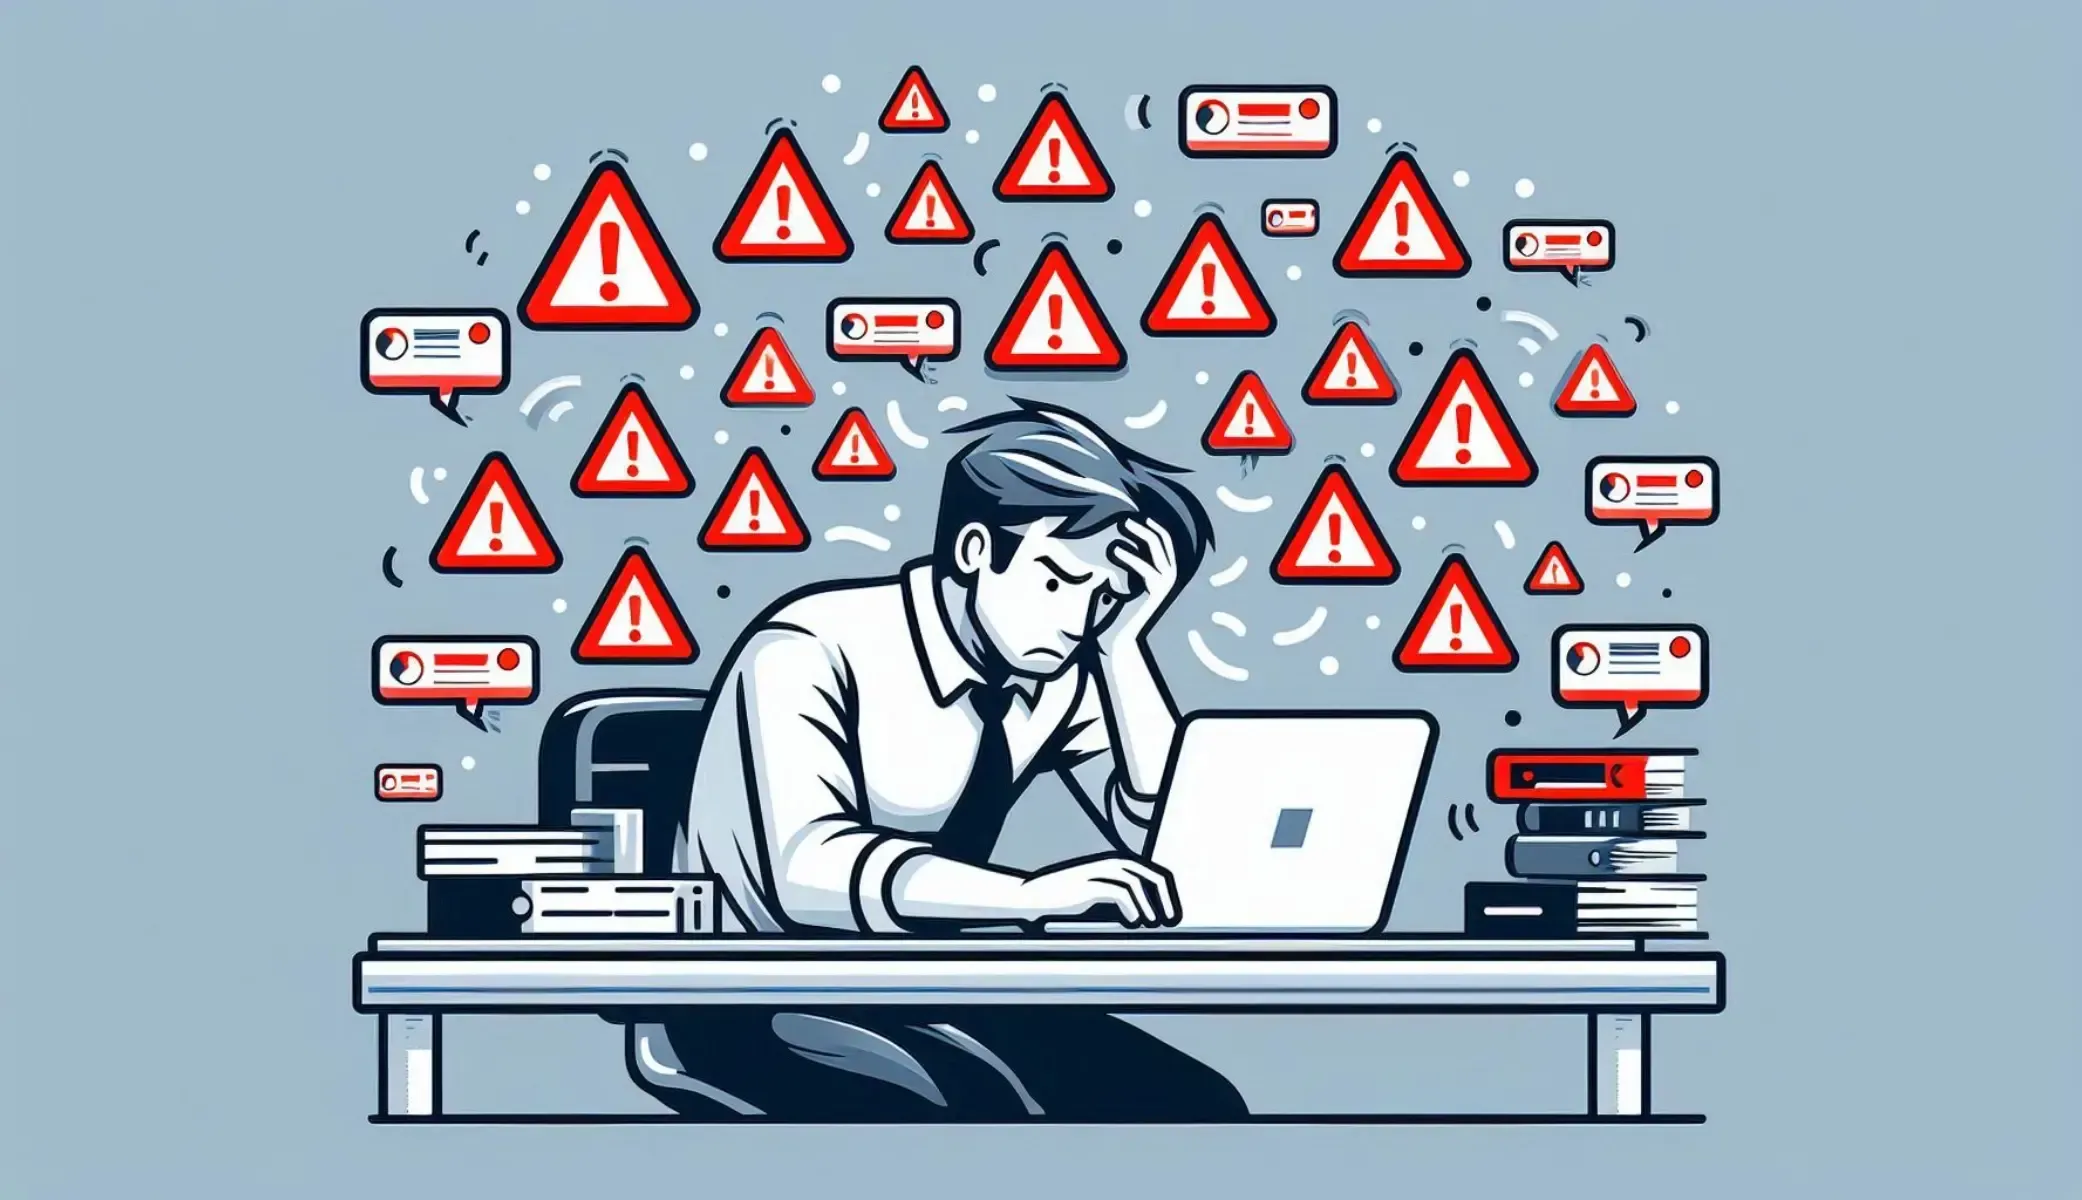
When Everything Is Urgent, Nothing Is
Alert fatigue doesn't start with a single bad alert. It starts with the 47th alert in a shift that turned out to be nothing. After enough false alarms, engineers start ignoring pages. After enough ignored pages, a real incident slips through. Then the post-mortem blames the engineer for not responding fast enough.
But alert fatigue isn't a people problem. It's a systems problem. And it has systems solutions — alert grouping, severity routing, quiet hours, and webhook filtering. OpShift implements all four, but the principles below apply to any incident response setup.
The Three Root Causes of Alert Fatigue
Most noisy alerting setups share the same three structural issues.
1. No Alert Grouping
When a service goes down, it doesn't generate one alert. It generates dozens. The load balancer sees timeouts, the health check fails, the dependent services start throwing errors, and the monitoring system fires a separate alert for each symptom.
Without grouping, the on-call engineer receives 30 notifications in 2 minutes — all for the same root cause. Each notification demands attention, creates context-switching overhead, and makes it harder to identify the actual problem.
Here's the difference:
| Without Grouping | With Grouping |
|---|---|
| 30 separate alerts | 1 parent alert with 30 occurrences |
| 30 notifications | 1 notification (plus silent occurrence updates) |
| Engineer must manually correlate | Occurrences linked to single timeline |
| Incident history scattered | Full occurrence history in one place |
Good alert grouping works by source: alerts from the same monitor, listener, or webhook are automatically grouped into a single parent alert. Additional occurrences are tracked silently — updating the count and timeline without firing new notifications.
2. No Severity Routing
Treating every alert the same is the fastest path to fatigue. A warning about elevated error rates and a critical database outage both trigger the same notification channel, the same escalation path, and the same urgency.
Severity routing means different alert levels take different paths:
- Low severity: Slack channel notification, reviewed during working hours
- Medium severity: Slack DM to on-call engineer, escalates after 30 minutes
- High severity: SMS + Slack DM, escalates after 15 minutes
- Critical severity: Phone call + SMS + Slack, escalates after 5 minutes
When engineers know that a phone call means something is genuinely broken, they respond immediately. When they know a Slack message can wait until morning, they sleep through the night without guilt.
3. No Quiet Hours
Not every alert needs to wake someone up at 3 AM. Disk usage trending upward? That's a business-hours conversation. A non-critical API returning slow responses? Queue it for the morning standup.
Quiet hours let each engineer define a do-not-disturb window in their own settings. Non-critical notifications stay suppressed during that window, while critical escalation steps can be configured to break through — the noise stays contained without risking a missed outage.
The Compounding Effect
These three issues don't just add up — they multiply. Without grouping, a single incident becomes 30 alerts. Without severity routing, all 30 get the same urgency. Without quiet hours, all 30 wake someone up at 3 AM.
The result: 30 high-urgency notifications at 3 AM for an issue that could have waited until morning.
Over time, the engineer's response is predictable and rational — they start ignoring alerts. They turn off their phone. They delay responses to see if the alert resolves itself. And then the one alert that actually matters gets the same delayed response.
Building a Low-Noise Alert Pipeline
Fixing alert fatigue requires changes at three levels: ingestion, routing, and delivery.
Step 1: Group at Ingestion
Every alert source (monitor, webhook, Slack listener) should have grouping enabled by default. When a new alert event fires:
- Check if an active (unresolved) alert exists for the same source
- If yes, add an occurrence to the existing alert — no new notification
- If no active alert exists, check for recently resolved alerts (within a reopen window, e.g., 24 hours)
- If a recently resolved alert exists, reopen it and notify
- If nothing matches, create a new alert and notify
This approach — inspired by how Sentry handles error grouping — collapses dozens of duplicate notifications into a single alert during major incidents.
Step 2: Route by Severity
Define clear severity levels and map each to a notification strategy:
- Critical: Immediate phone call, then SMS, then Slack DM. Escalate after 5 minutes.
- High: SMS + Slack DM. Escalate after 15 minutes.
- Medium: Slack DM only. Escalate after 30 minutes.
- Low: Slack channel only. No escalation; reviewed in the channel during working hours.
The key is that severity is assigned at the alert source level, not after the fact. Monitors for production databases get high/critical severity. Monitors for staging environments get low severity.
Step 3: Enforce Quiet Hours
Quiet hours work per engineer, not per team — each person sets their own do-not-disturb window:
- Define the quiet window (e.g., 10 PM to 8 AM local time) in your notification settings
- Mark critical and high severity escalation steps to bypass quiet hours, so real outages still page
- Medium and low severity notifications are suppressed during the window — the alert itself stays visible on the dashboard and in the Slack channel
- Review anything suppressed overnight when you're back at the keyboard
Step 4: Filter Before Alerting
For webhook-based alerts, add condition filters to prevent noise at the source. Common patterns:
- Only alert on production environments (filter out staging, dev, local)
- Only alert when error count exceeds a threshold (not on every single error)
- Exclude known non-issues (specific error codes, expected maintenance windows)
Filters should support flexible matching: equals, contains, greater-than, regex, and logical operators (all conditions must match, any condition must match, or none of the conditions should match).
Measuring Improvement
After implementing these changes, track these metrics:
- Alert volume per shift: Should drop sharply once grouping and filtering land
- Signal-to-noise ratio: Percentage of alerts that required action (target: above 80%)
- Mean time to acknowledge (MTTA): Should decrease as engineers trust the system
- After-hours notifications: Should decrease for non-critical issues
- Engineer satisfaction surveys: The qualitative measure that matters most
Stop Blaming Engineers for Bad Tooling
Alert fatigue is solvable. It requires grouping to reduce volume, severity routing to match urgency to notification channel, quiet hours to protect off-hours, and filtering to stop noise at the source.
OpShift includes all four of these capabilities out of the box — alert grouping with occurrence tracking, severity-based notification policies across Slack, SMS, and phone, per-user quiet hours, and webhook filtering with condition-based rules. Pricing is flat: $16/month (Basic) or $39/month (Pro), both for up to 100 team members — the difference is included SMS/voice credits. No per-seat charges that penalize you for giving every engineer access. Learn more at opshift.io.